

This page lists some of the sample applications which come with the SDL Component Suite. You may download the examples including the executables (for Windows) in order to get a quick impression of the functionality of the SDL Component Suite. Some of the programs listed below are delivered with the SDL Component Suite both as Pascal and as C++ sources.
| Program | Unit / Component |
Description | Download |
|---|---|---|---|
| atlas | GeoAtlas | 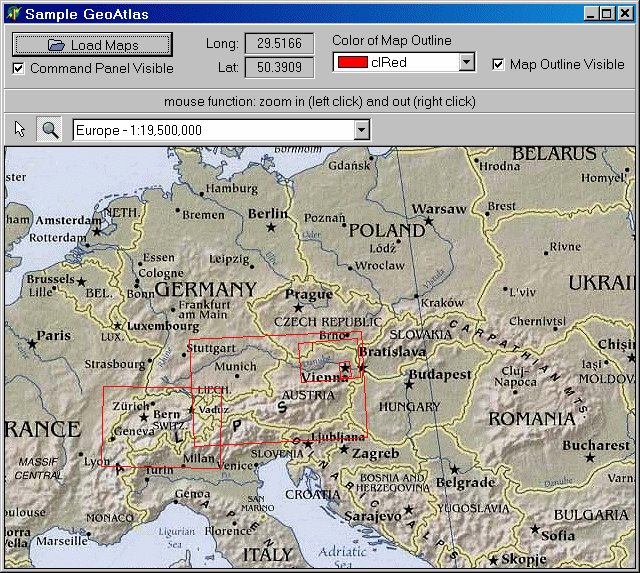 Shows how to use the unit GEOATLAS. Several calibrated maps of Europe, Austria and Switzerland are come along with this application. You can zoom into the area of Vienna.
 |
atlas.zip
(4.7 MB) 
|
| box_plot | BoxPlot |  This sample application shows most of the features of the TBoxPlot component. The user may change the data as well as the layout of the box plots. This sample application shows most of the features of the TBoxPlot component. The user may change the data as well as the layout of the box plots. |
box_plot.zip
(394 kB) |
| chartpolygons | RChart | This example shows how to draw filled polygons within RChart. The polygons are fully scalable. | chartpolygons.zip
(337 kB) |
| clock | PolChart |  A simple application of the unit POLCHART, implementing a clock. You may rotate the clock at will (just for fun).
 |
clock.zip
(296 kB)
|
| cluster | Math2 |  Calculates a dendrogram using the procedure AgglomClustering of the unit MATH2.
The dendrogram is displayed in an RCHART window.
Calculates a dendrogram using the procedure AgglomClustering of the unit MATH2.
The dendrogram is displayed in an RCHART window. |
cluster.zip
(419 kB) |
| colorcalc | SDLColors |  Uses the unit SDLCOLORS to convert HSI (hue, saturation, intensity) values to RGB (red, green, blue). The user may set the HSI values to compose a color. The selected color is displayed as an HTML value, too. Uses the unit SDLCOLORS to convert HSI (hue, saturation, intensity) values to RGB (red, green, blue). The user may set the HSI values to compose a color. The selected color is displayed as an HTML value, too. |
colorcalc.zip
(261 kB) |
| colorsel | ColSel | Allows to select colors from a color drop down list created by COLSEL. | colorsel.zip
(279 kB) |
| colscale | ColorScale |  This sample program shows all major aspects of the TColorScale component. This sample program shows all major aspects of the TColorScale component. |
colscale.zip
(288 kB) |
| contplot | TContourPlot/ RChart |
 An example program showing the usage of TContourPlot. An example program showing the usage of TContourPlot.
|
contplot.zip
(326 kB) |
| convexhull | Math2 |  This program shows how to use MATH2 to calculate the convex hull of two-dimensional data. In addition, the area of the hull polygon is calculated. This program shows how to use MATH2 to calculate the convex hull of two-dimensional data. In addition, the area of the hull polygon is calculated.
|
convexhull.zip
(335 kB) |
| covar | Math2 | Calculates the covariance matrix using the units MATH2 and MATRIX. | covar.zip
(312 kB) |
| cpuinfo | CpuId | Retrieves the most important CPU specific data using the unit CPUID. | cpuinfo.zip
(225 kB) |
| curvefit | Math2 |  Calculates the regression curve for arbitrary data points. The user may
select from linear, parabolic, polynomial, hyperbolic, reciprocal, or logarithmic
functions. The regression is calculated using the unit MATH2
and displayed by RCHART.
Calculates the regression curve for arbitrary data points. The user may
select from linear, parabolic, polynomial, hyperbolic, reciprocal, or logarithmic
functions. The regression is calculated using the unit MATH2
and displayed by RCHART. |
curvefit.zip
(403 kB) |
| dendro | RChart |  dendro performs a cluster analysis and displays the results as a dendrogram using the unit DENDROGRAM. The user may experiment with various parameters of the clustering algorithm. dendro performs a cluster analysis and displays the results as a dendrogram using the unit DENDROGRAM. The user may experiment with various parameters of the clustering algorithm.
| dendro.zip
(357 kB)
|
| duallayer | RChart |  duallayer shows how display data on two independently scaled RCHART layers. The user may select one or both of the two layers and pan and zoom the selected layer. In addition, a few standard layouts of the axes can be chosen. duallayer shows how display data on two independently scaled RCHART layers. The user may select one or both of the two layers and pan and zoom the selected layer. In addition, a few standard layouts of the axes can be chosen.
| duallayer.zip
(342 kB) |
| dynamicgf | GradFill |  dynamicgf shows how to create several gradfill components on a form dynamically.
The program uses the unit GRADFL. dynamicgf shows how to create several gradfill components on a form dynamically.
The program uses the unit GRADFL. |
dynamicgf.zip
(235 kB) |
| exrot3d | Rot3D |  exrot3D shows a simple application how to rotate three dimensional data in order to create the impression of a 3D view. The program uses the unit ROT3D.
 |
exrot3d.zip
(344 kB) |
| fdistri | Statis |  The program fdistri calculates and displays the f distribution
for various degrees of freedom using the unit STATIS.
The program fdistri calculates and displays the f distribution
for various degrees of freedom using the unit STATIS. |
fdistri.zip
(340 kB)
|
| fft | Fourier |  Displays the Fourier transform spectrum of a periodic signal. The user may adjust
the noise level and the frequency of one component of the signal (unit
FOURIER).
Displays the Fourier transform spectrum of a periodic signal. The user may adjust
the noise level and the frequency of one component of the signal (unit
FOURIER). |
fft.zip
(358 kB) |
| fft60hz | Fourier | Simple program showing how to process a 60 Hz sine signal using the unit FOURIER. The program shows both the frequency and the integer harmonics. The signal is sampled at 187500 Hz. Sources of the sample program included. | fft60hz.zip
(329 kB)
|
| findcent | Math2 | Calculates the "centers" in an n-dimensional data space by performing a cluster analysis. Uses the unit MATH2. | findcent.zip
(351 kB)
|
| foldertree | FolderTree |  Shows the functionality of the TFolderTree component. The user may adjust several visual parameters and experiment with the directory tree (unit
FOLDERTREE).
Shows the functionality of the TFolderTree component. The user may adjust several visual parameters and experiment with the directory tree (unit
FOLDERTREE). |
foldertree.zip
(520 kB) |
| foursynt | Fourier |  Shows how to use the inverse FFT of unit FOURIER
to synthesize waves.
Shows how to use the inverse FFT of unit FOURIER
to synthesize waves. |
foursynt.zip
(338 kB) |
| ftfilter | Fourier |  Shows how to use the Fourier transformation for filtering purposes. The program implements
a simple low-pass filter with adjustable cut-off frequency. It is
based on the FFT component FOURIER. The
charts are displayed using RCHART.
Shows how to use the Fourier transformation for filtering purposes. The program implements
a simple low-pass filter with adjustable cut-off frequency. It is
based on the FFT component FOURIER. The
charts are displayed using RCHART. |
ftfilter.zip
(311 kB) |
| funcplot | Math2 | This sample application shows how to use TMathExpression of unit MATH2 for implementing a simple function plotter. The chart is displayed using RCHART. | funcplot.zip
(292 kB)
|
| gaugesample | RChart |  The program "gaugesample" shows the application of the TScaleGauge component. The program "gaugesample" shows the application of the TScaleGauge component. |
gaugesample.zip
(277 kB) |
| geocal3p | GeoMap |  This sample application shows how to perform a 3-point calibration of a map assuming that the scale of the map is sufficiently small so that the graticule will be linear. This sample application shows how to perform a 3-point calibration of a map assuming that the scale of the map is sufficiently small so that the graticule will be linear. |
geocal3p.zip
(5.5 MB)
|
| geodata | GeoDb |  Shows how to read and write data of the geo database (unit GEODB). The data of the database (Austrian border and several cities) is displayed using an RCHART. You may pan the map, and zoom in and out.
 |
geodata.zip
(484 kB) |
| gradfill | GradFl |  Displays a filled color gradient using the component TGradFill of unit GRADFL.
 |
gradfill.zip
(296 kB) |
| grep | StringL | Shows the application of the class TGrep in unit STRINGL for searching in texts by means of regular expressions. | grep.zip
(281 kB) |