

This page lists some of the sample applications which come with the SDL Component Suite. You may download the examples including the executables (for Windows) in order to get a quick impression of the functionality of the SDL Component Suite. Some of the programs listed below are delivered with the SDL Component Suite both as Pascal and as C++ sources.
| Program | Unit / Component |
Description | Download |
|---|---|---|---|
| rasterlabel | RasterLab |  Shows the capabilities of the unit RASTERLAB. You can
adjust most of the properties of the dot matrix display. This program can be used to experiment with the dot matrix display before implementing a concrete layout in your own application. Shows the capabilities of the unit RASTERLAB. You can
adjust most of the properties of the dot matrix display. This program can be used to experiment with the dot matrix display before implementing a concrete layout in your own application. |
rasterlabel.zip (319 kB) |
| rch2win | RChart | rch2win shows moving data points and a swinging rod in two RCHART windows. | rch2win.zip (337 kB) |
| rch3dbar | RChart |  A simple application to display bargraphs using RCHART. The angle, depth and height of the bars can be changed.
 |
rch3dbar.zip (340 kB) |
| rchdrag | RChart | An application which shows how to drag data displayed within an RCHART by the mouse. | rchdrag.zip
(343 kB) |
| rchfifo | RChart |  RCHART is used to display a "running" chart like in chart recorders. RCHART is used to display a "running" chart like in chart recorders. |
rchfifo.zip
(333 kB) |
| rchmouse | RChart | A simple application to display the chart coordinates of the mouse cursor within RCHART. | rchmouse.zip
(367 kB) |
| rchmovel | RChart | Moving data points over fixed graphs (using RCHART). | rchmovel.zip
(385 kB) |
| rchzoomp | RChart | Application showing the different zoom modes of RCHART. | rchzoomp.zip
(371 kB) |
| rclegend | RChart |  This sample program shows how to create a legend on the RCHART canvas. This sample program shows how to create a legend on the RCHART canvas. |
rclegend.zip
(303 kB) |
| rcshared | RChart |  This application nicely shows how set up several RCHARTs which share common data.
 |
rcshared.zip
(346 kB) |
| rctextlabels | RChart |  Shows the application of text labels within a chart. You can move the labels by mouse and set some of the parameters of a label. Uses units RCHART
and COLSEL.
Shows the application of text labels within a chart. You can move the labels by mouse and set some of the parameters of a label. Uses units RCHART
and COLSEL. |
rctextlabels.zip
(349 kB) |
| rctstspd | RChart | If you are keen to know how fast RCHART really is, you should download and start this little application (typical drawing speed: about 1000 CPU cycles per data point + overhead for drawing scales etc., resulting in a total redraw time of 0.2 sec for 50000 data points on a 500 MHz CPU). The included sources are for Delphi™ 4 or higher. | rctstspd.zip
(339 kB) 
|
| repldragdrop | RepList | Shows how to implement drag and drop using the report listview contained in unit REPLIST. | repldragdrop.zip
(297 kB) |
| replistv | RepList |  Shows the capabilities of the unit REPLIST.
 |
replistv.zip
(373 kB) |
| repspeedbut | RepSBut |  Shows the capabilities of the component TRepSBut. The user may experiment with both the intial period and the interval between clicks. The sample program also shows the difference between the OnClick and the OnRepeatClick event. Shows the capabilities of the component TRepSBut. The user may experiment with both the intial period and the interval between clicks. The sample program also shows the difference between the OnClick and the OnRepeatClick event. |
repspeedbut.zip
(256 kB) |
| rotlabel | RotLab |  Shows the capabilities of the unit ROTLAB.
 |
rotlabel.zip
(273 kB) |
| scalemeter | Scale |  Shows the usage of the unit SCALE as a simple gauge by using the events OnBeforeScaleRendered and OnAfterScaleRendered. Shows the usage of the unit SCALE as a simple gauge by using the events OnBeforeScaleRendered and OnAfterScaleRendered.
|
scalemeter.zip
(296 kB)
|
| schart | SmithChart |  Shows the usage of the component SMITHCHART to display complex s-parameters of an electronic circuit. Shows the usage of the component SMITHCHART to display complex s-parameters of an electronic circuit.
|
schart.zip
(310 kB) |
| sdlprogbar | ProgBar |  Shows
the capabilities of the unit PROGBAR. You can
adjust most of the properties of the progress bar. This program can be used to experiment with the progress bar before implementing a concrete layout in your own application. Shows
the capabilities of the unit PROGBAR. You can
adjust most of the properties of the progress bar. This program can be used to experiment with the progress bar before implementing a concrete layout in your own application.
|
sdlprogbar.zip
(303 kB) |
| sevenseg | SevenSeg |  Shows the capabilities of the unit SEVENSEG. The user may adjust all major parameters of the component.
 |
sevenseg.zip
(273 kB) |
| shcstruk | ChemGrph |  The program shcstruk displays chemical structures read from MDL MOL files. The program uses the unit CHEMGRPH to display the structure.
 |
shcstruk.zip
(297 kB) |
| simplegeomap | GeoMap |  A calibrated map of Austria is provided along with this application. The program uses the unit GEOMAP to display the geographic maps.
 |
simplegeomap.zip
(744 kB)
|
| simplepca | Math2 |  This program shows how to implement a principal component analysis (PCA) using the unit MATH2. The data set supplied with this sample program contains geometric data of genuine and counterfeit banknotes. The two classes of banknotes can be clearly discriminated (data set courtesy of H. Riedwyl, Bern, Switzerland). This program shows how to implement a principal component analysis (PCA) using the unit MATH2. The data set supplied with this sample program contains geometric data of genuine and counterfeit banknotes. The two classes of banknotes can be clearly discriminated (data set courtesy of H. Riedwyl, Bern, Switzerland).
|
simplepca.zip
(446 kB) |
| slides | Thumbnails | 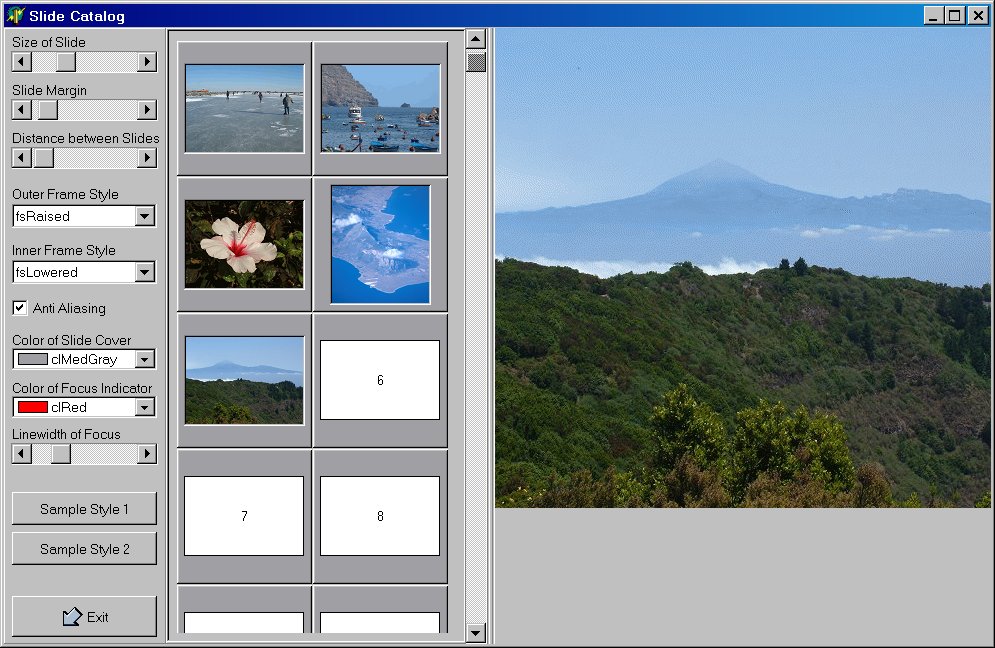 This program shows how to create a slide catalog by using the unit THUMBNAILS. This program shows how to create a slide catalog by using the unit THUMBNAILS. |
slides.zip
(722 kB) |
| sline | SLine |  This program shows how to use the TSLine component for calculating the intersections of straight lines. This program shows how to use the TSLine component for calculating the intersections of straight lines. |
sline.zip
(322 kB) |
| sortarray | Math1 | This program shows how to sort both static and dynamic arrays using the procedure SortArray of the unit MATH1. | sortarray.zip
(284 kB) |
| spline | Math2 |  This program shows the calculation of splines (using the unit MATH2). You can move the data points, and set the border conditions (natural splines, or 1st derivative at border point). In addition, you can create a smoothed spline, which can be varied in smoothness between no smoothing (resulting in a natural spline) and full smoothing (linear regression line).
 |
spline.zip
(365 kB)
|
| testvec | Vector | A simple program to show the application of the class TVector (unit VECTOR). | testvec.zip
(295 kB) |
| userspec | RChart | This program shows how to implement user-specific extensions of an RCHART. | userspec.zip
(329 kB) |
| waveletcoeff | Math2 |  This program calculates individual Daubeschies wavelets by means of the inverse wavelet transformation. The user may set the order of the wavelet and the coefficient.
 |
waveletcoeff.zip
(323 kB) |